Clusterfudgebuilt for AI infrastructure teams
Built by talent from


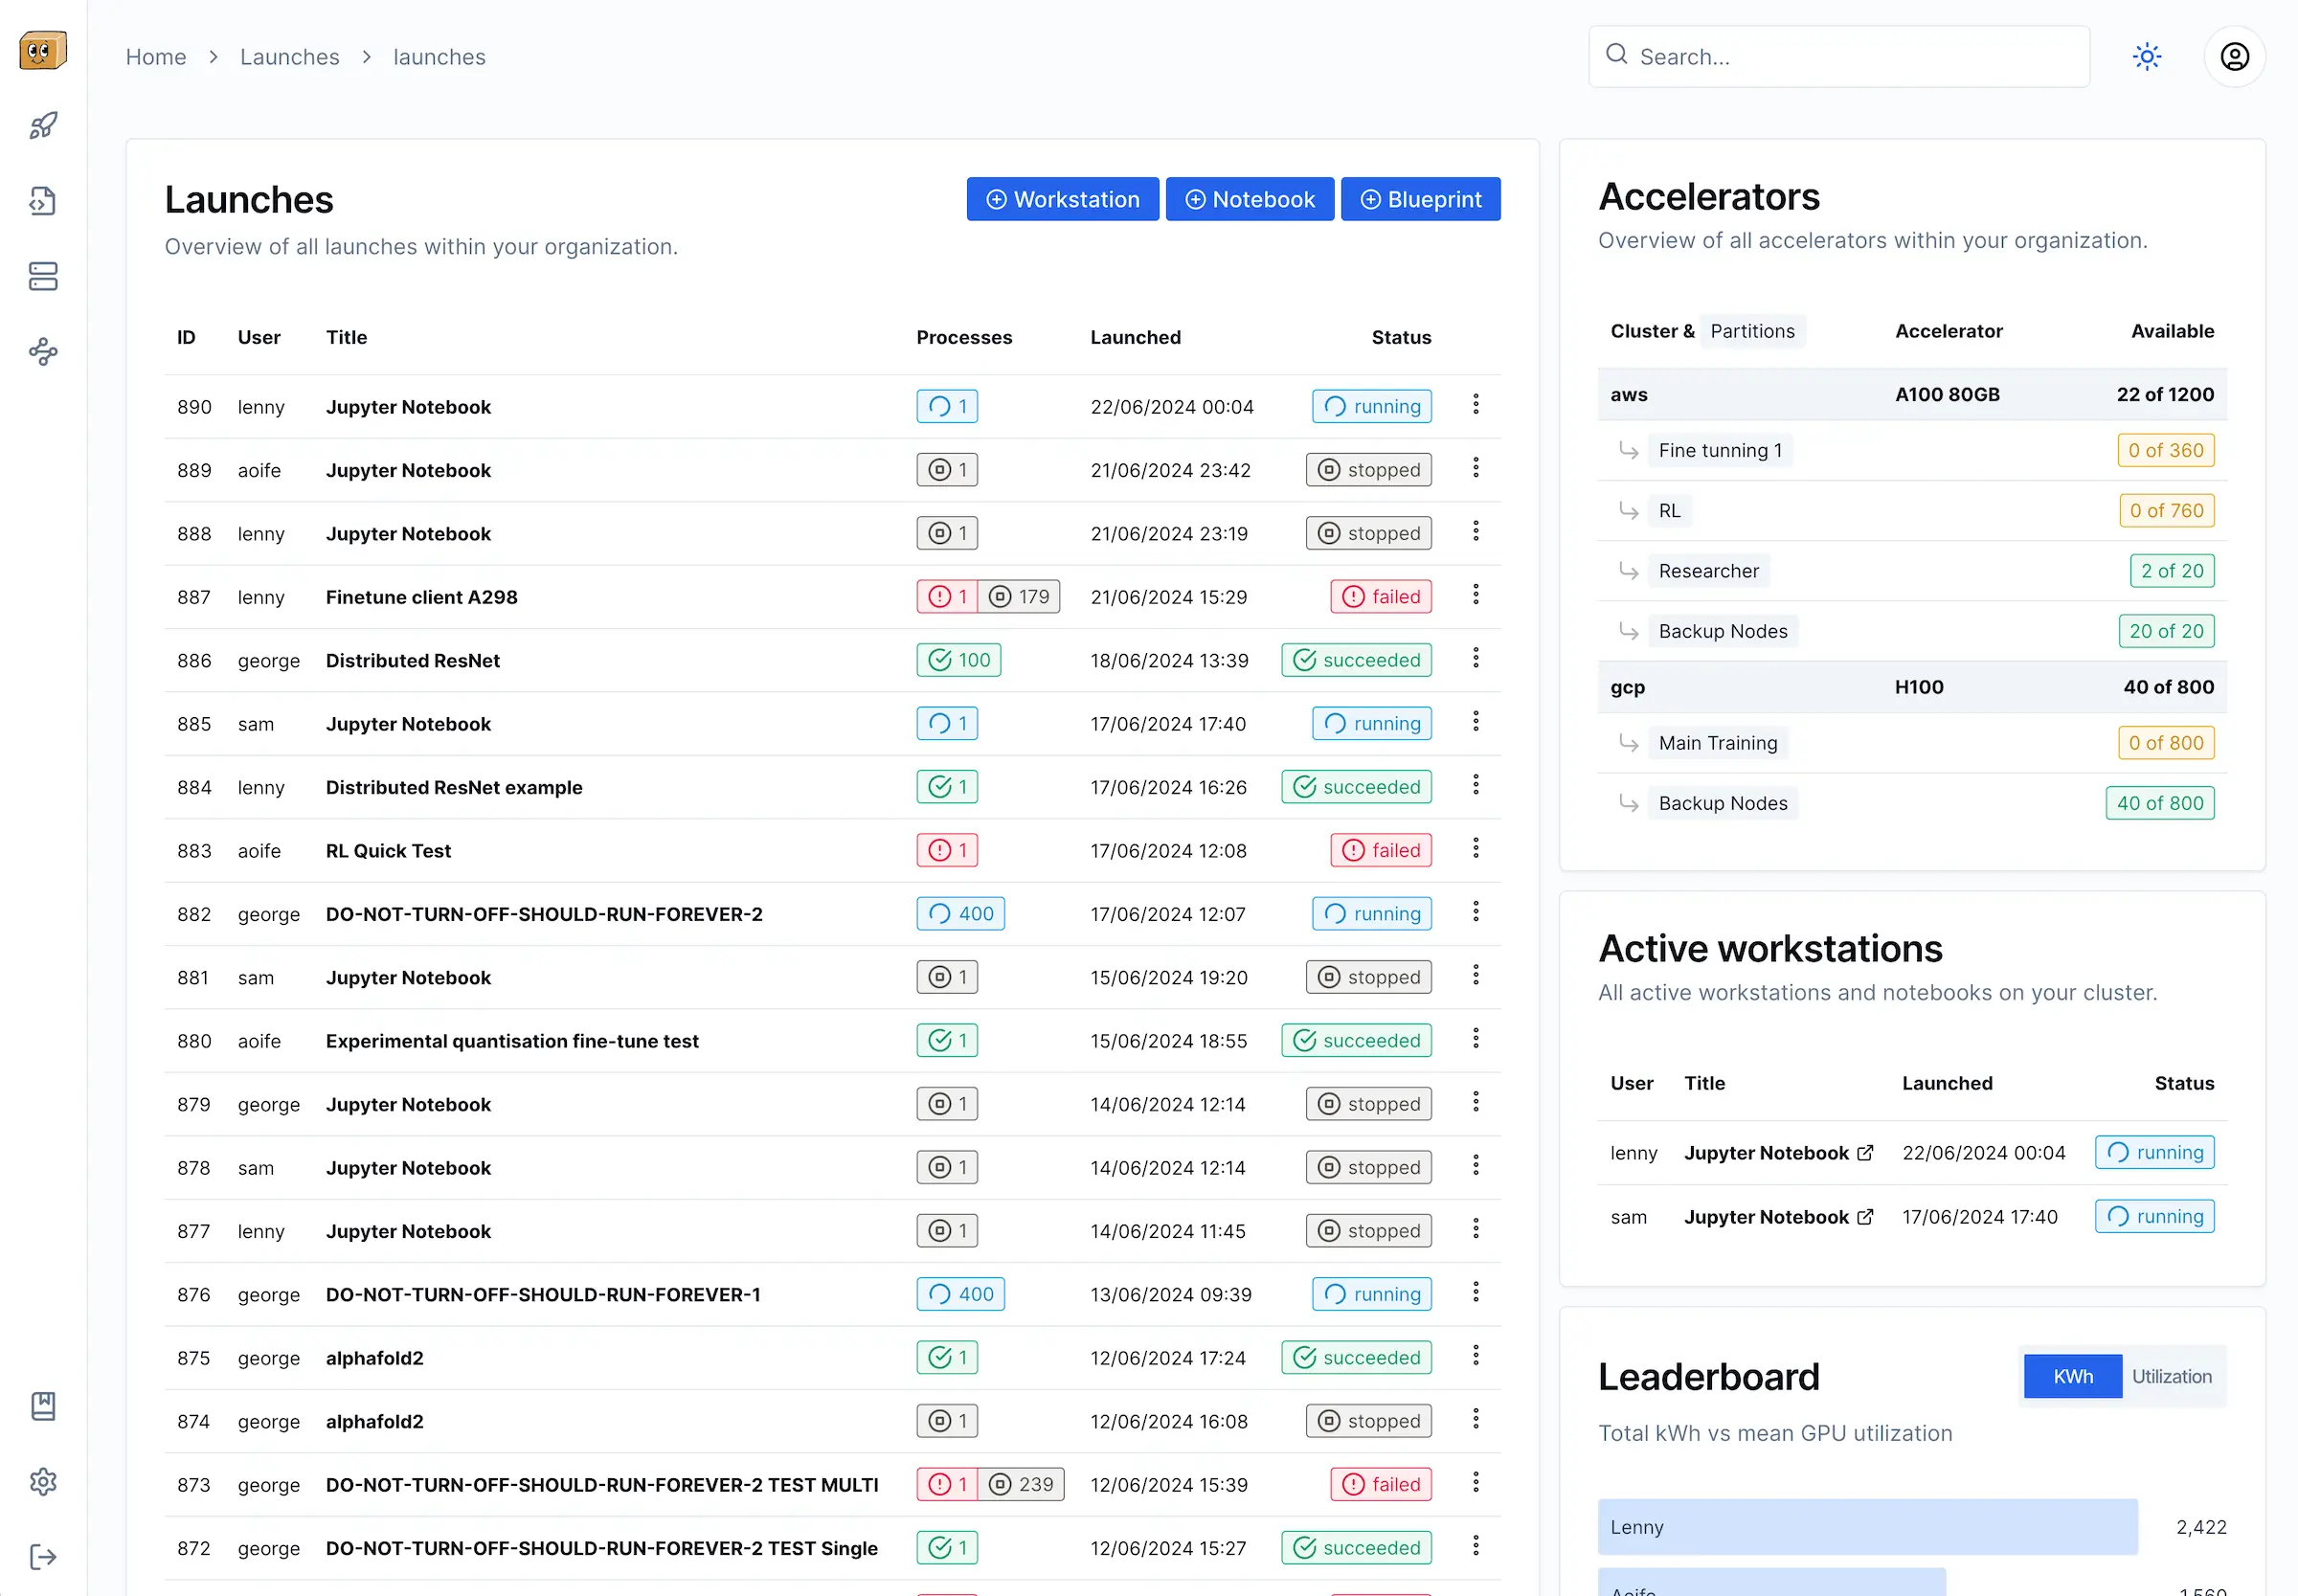
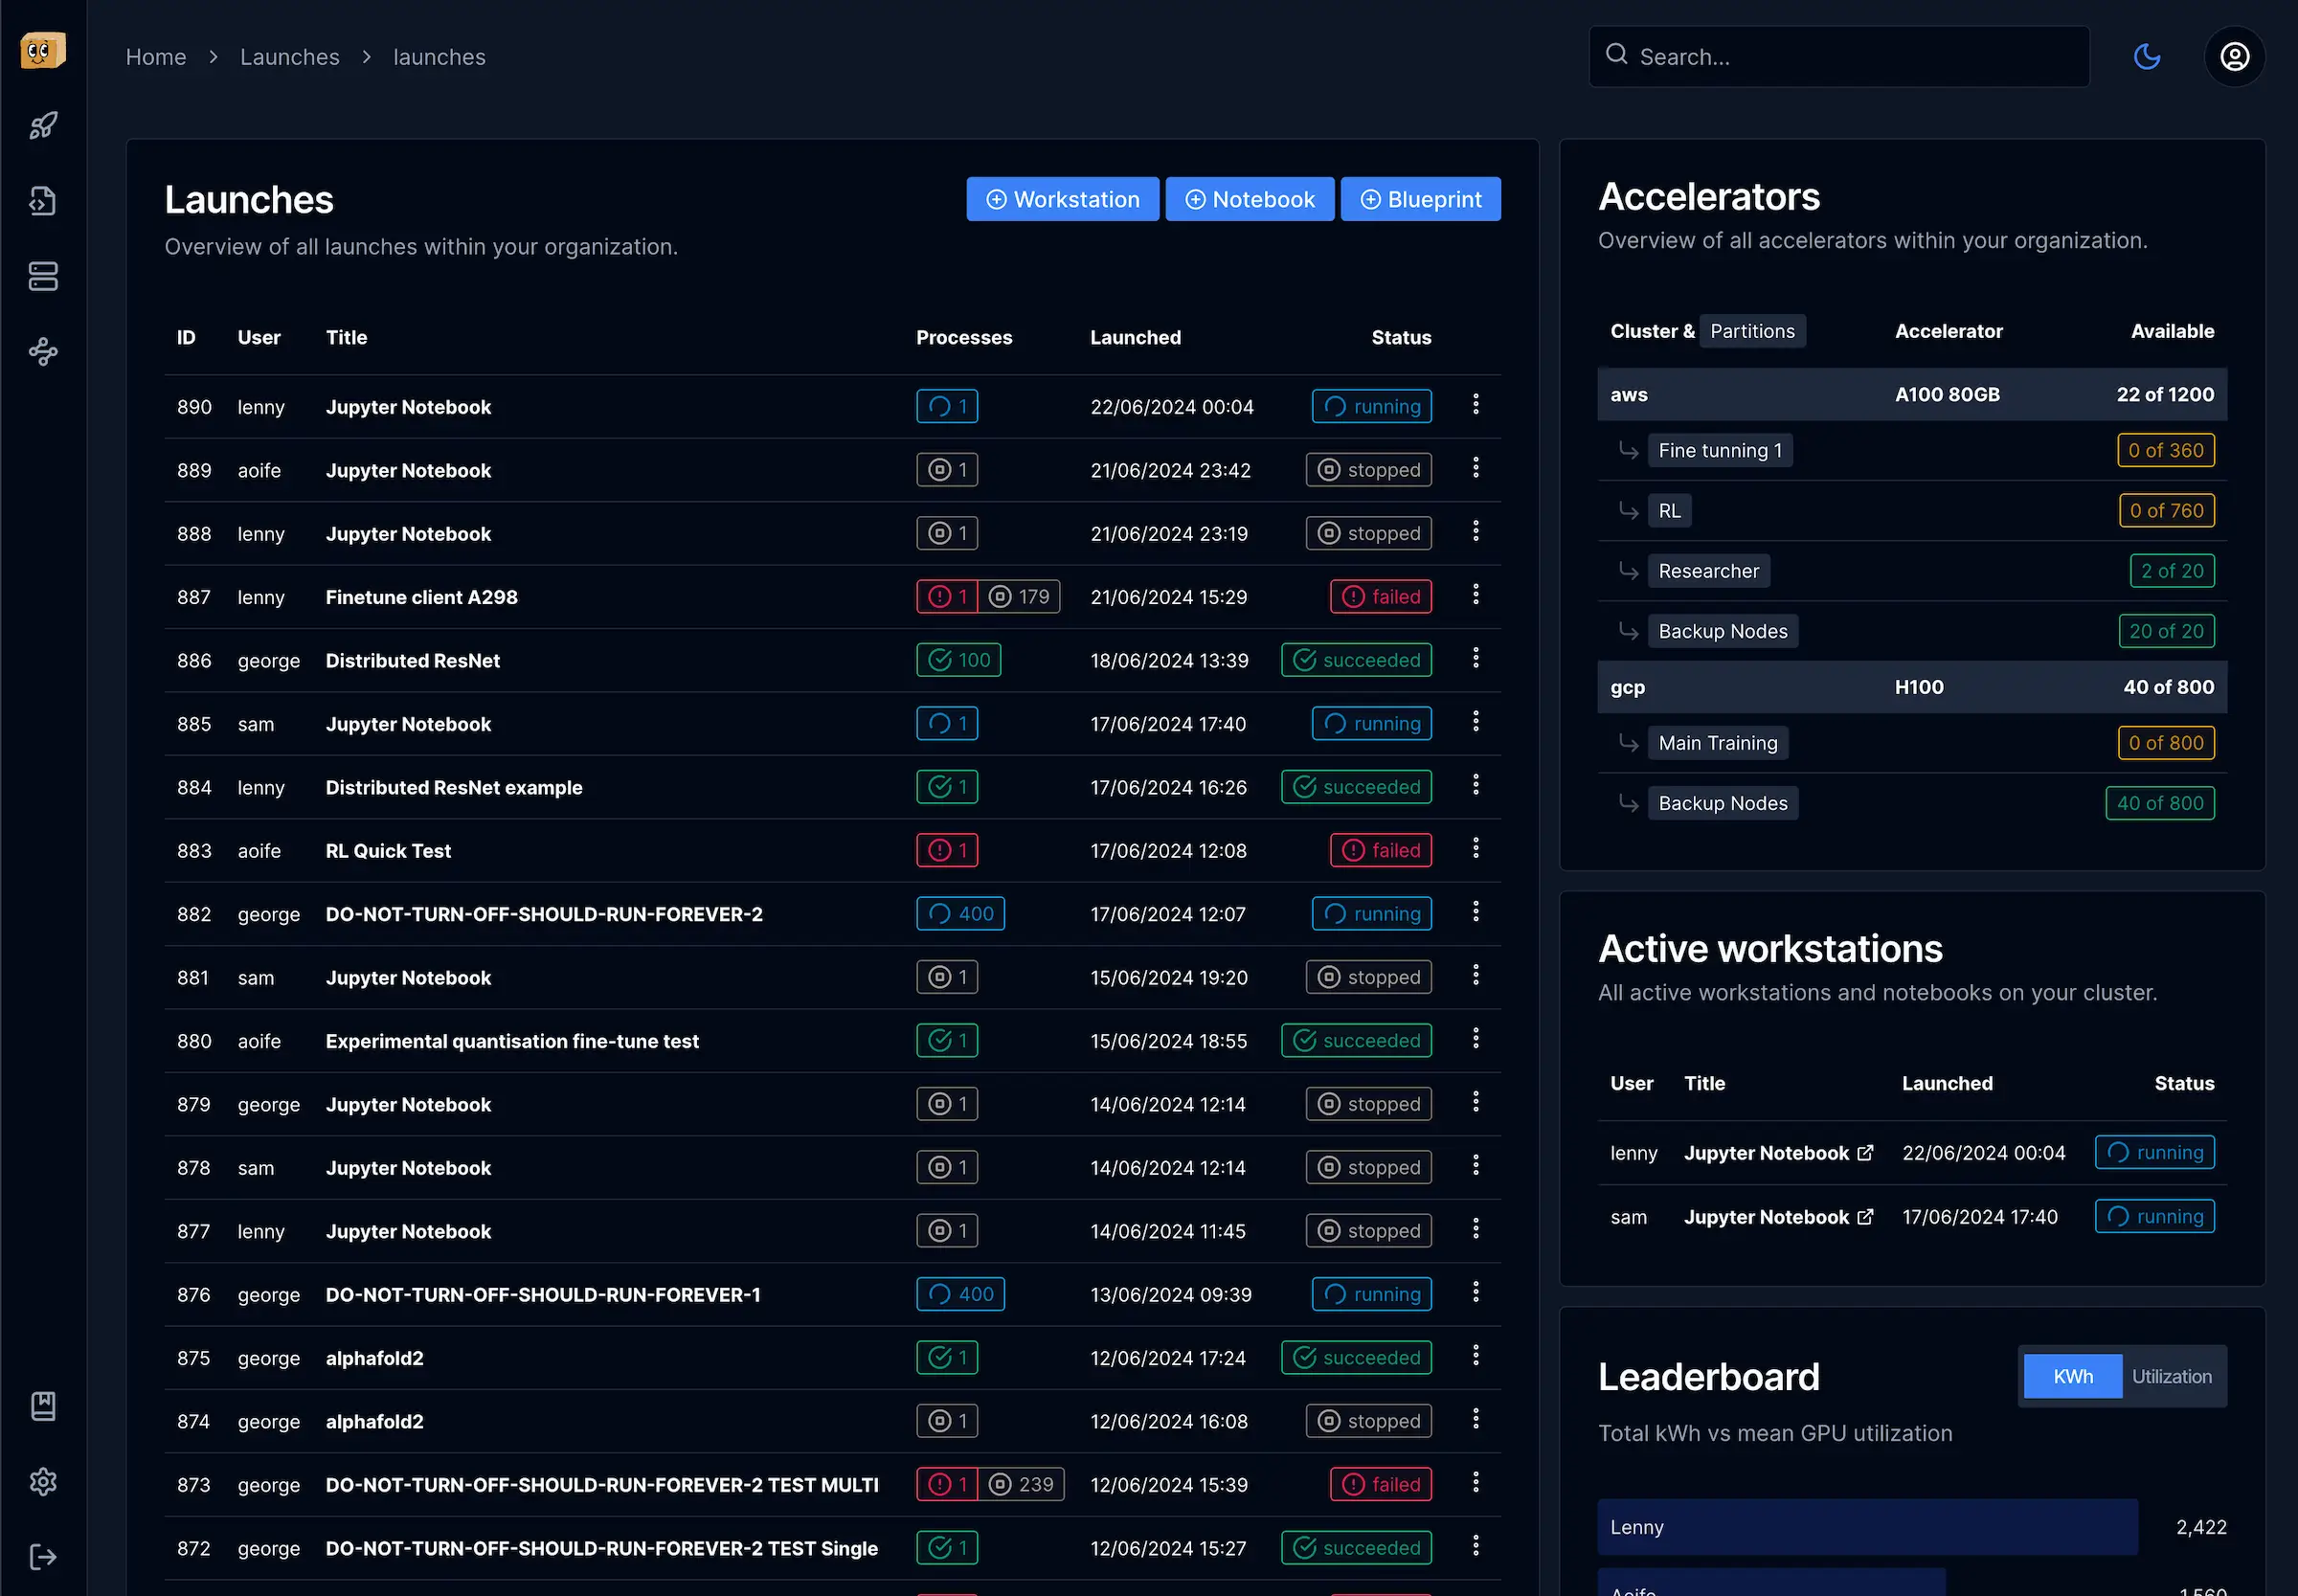
Infrastructure management made simple
Everything platform engineers need
Manage your AI infrastructure from a single platform. Monitor resources, allocate GPUs, track utilization, and support your research teams.
GPU Monitoring
Track GPU usage, memory, temperature and health. Get alerts for hardware issues before they impact your researchers.
Resource Allocation
Allocate GPUs to teams and projects. Monitor utilization and optimize resources to maximize ROI.
Slurm Integration
Seamless integration with Slurm for job scheduling. Monitor queues, job status, and resource usage.
Usage Reporting
Generate detailed reports on GPU utilization, power consumption, and resource allocation to inform capacity planning.
Researcher Tooling
Provide seamless tools for your researchers: web dashboard, VS Code extension, and Python API for launching jobs.
Infrastructure Automation
Automate common tasks like node recovery, disk cleanup, and GPU configuration to reduce operational burden.
Easy setup
Run Clusterfudge in one-line, with zero config and no dependencies.
Sign up
Sign up to get an API key and personalised command to run our agent — Fudgelet.Sign up to get an API key and personalised command to run our agent — Fudgelet.
Run Fudgelet
Run Fudgelet on your compute node. This auto-detects GPUs and allows it to run workloads.Run Fudgelet on your compute node. This auto-detects GPUs and allows it to run workloads.
Launch workloads
Launch notebooks and workstations via the web, or write your own launches using our Python API.Launch notebooks and workstations via the web, or write your own launches using our Python API.
$ curl https://get.clusterfudge.com/run.sh |
API_KEY=<your-api-key> bashOptimize resource utilization
Streamline job management
Ready to transform your AI infrastructure?
Join leading AI labs using Clusterfudge to streamline infrastructure management, maximize resource utilization, and accelerate research.